
Investor Readiness
The Financial Metrics Investors in Startups Really Want to See
A pitch deck shows growth. The key metrics behind it reveal whether that growth is sustainable. ARR, unit economics, burn rate, and retention: what investors really want to see—and how to calculate them accurately.
04.11.2026
You’ve prepared a pitch deck with twelve slides full of numbers, and the investor interrupts you after slide three with a single question to which you don’t have a clear answer. Most of the time, it’s not the revenue figure that catches you off guard. It’s the metric behind it that shows whether your growth is truly sustainable.
Investors don’t look at as many numbers as possible; instead, they focus on a few that, taken together, paint a clear picture: Is the company growing in a way that’s both profitable and scalable, or is growth coming at a high cost? This article shows you which financial metrics really matter in investor meetings, how to interpret them correctly, and where founders most often stumble.
Key Points at a Glance
Investors evaluate startups based on a few key metrics: growth (ARR/MRR), efficiency (unit economics such as CAC and LTV), liquidity (burn rate, runway), and customer retention (churn, net revenue retention). Individual key figures rarely stand out on their own. Only the interplay between growth and efficiency reveals whether a business model can scale sustainably.
Guidelines at a Glance
- ARR growth starting with Series A → a threefold increase year-over-year is considered a strong indicator
- LTV:CAC ratio → at least 3:1
- CAC Payback → Less Than 18 Months
- Net Revenue Retention → over 100%
Why Investors Look More Closely at Financial Ratios Than You Might Think
A pitch deck can demonstrate growth. Whether that growth is profitably scalable becomes clear only when you look at the underlying metrics. Investors know that revenue growth alone means little if it comes at the cost of a disproportionately high capital outlay. That’s why they examine not only how fast a startup is growing, but also how efficiently and sustainably its growth phase is structured. It’s typical for investors to ask about the gross margin immediately after inquiring about growth figures. This indicates whether growth is driven by operational performance or is merely purchased.
For you as a founder, this means: The key metrics you present shouldn’t just look good—they should be derived in a way that stands up to scrutiny. An investor who asks questions for just two minutes will spot inconsistencies faster than you’d like.
Growth Metrics: Understanding ARR, MRR, and Growth Rates
ARR (Annual Recurring Revenue) and MRR (Monthly Recurring Revenue) are the starting point for every investor discussion regarding subscription models. It is important to clearly distinguish between recurring revenue and one-time payments. Setup fees or project work do not count toward ARR.
Just as important as the absolute number is the growth rate over time. A rule of thumb in the venture capital world: Starting with Series A, a threefold increase in ARR year-over-year is considered a strong signal, though it is no longer necessarily expected. Given the interest rate environment of recent years, solid, consistent growth is sufficient as long as efficiency is on point.
Unit Economics: CAC, LTV, and Why the Ratio Matters
Unit economics describe whether a single customer makes the company profitable, regardless of overall growth. CAC (Customer Acquisition Cost) is the cost of acquiring a customer. Customer Lifetime Value (LTV) is the amount that customer generates over the course of the entire customer relationship.
Investors focus less on the absolute values and more on the relationship between them: An LTV:CAC ratio of at least 3:1 is considered a healthy benchmark; below that, growth comes at a structurally high cost. Equally relevant: How long does it take for CAC to pay for itself? Payback periods of more than 18 months are a red flag for many investors because they tie up a lot of capital before the investment becomes profitable.
Liquidity: Burn Rate and Runway as an Early Warning System
The burn rate is a startup’s monthly net cash burn. The runway indicates how many months the current capital will last if the burn rate remains constant. Both metrics serve as the ultimate early warning system for investors, as they indicate how much time remains until the next funding round and how much negotiating leverage the startup has in that process.
A short runway just before a funding round significantly weakens your negotiating position. Investors know that a startup with a three-month runway has little time to negotiate. If you actively manage your burn rate and runway—rather than calculating them at the last minute—you’ll be negotiating from a much stronger position.
Retention: Why Churn and Net Revenue Retention Are Key Factors in Valuation
Churn is the percentage of customers or revenue lost over a given period. Net Revenue Retention (NRR) shows how revenue from existing customers changes over time, taking into account upsells and churn. Together, these two metrics indicate how stable the foundation of a business model is.
An NRR above 100% means that, on average, existing customers spend more than is lost to churn. This is a strong indicator of product-market fit. If it is significantly below that level, any growth becomes fragile because it must be driven primarily by acquiring new customers rather than growing from the existing customer base.
The 3 Most Common Mistakes in Presenting Key Metrics
If you avoid these three mistakes, you’ll gain one thing above all else: time during the conversation that would otherwise be spent asking clarifying questions.
- Key metrics without context: A high growth rate without putting it into the context of unit economics seems arbitrary rather than reliable.
- Inconsistent definitions: If ARR is sometimes calculated with one-time payments and sometimes without them, this becomes apparent the first time a question is raised and erodes trust.
- Hidden negative developments: An experienced investor will uncover them anyway. A startup that openly acknowledges and addresses these issues comes across as more mature than one that hides them.
After the Funding Round: Turning Key Metrics into Reports
The work on your key metrics doesn't end with the closing. From now on, investors expect regular updates with the exact figures they reviewed during due diligence.
If you clearly define ARR, burn rate, and retention before the funding round, you can incorporate this structure directly into your ongoing reporting. To get started, check out our free KPI dashboard for SaaS companies, which automatically compares planned and actual figures. Our guide to investor reporting shows you what a reporting system that meets even the highest investor standards looks like.
Conclusion on Financial Metrics in Startups
Investors don’t evaluate startups based on individual key metrics, but rather on the interplay of growth, efficiency, liquidity, and customer retention. Those who can clearly derive ARR and MRR, understand unit economics, actively manage burn rate and runway, and keep an eye on retention metrics will not only be better prepared but also have a stronger negotiating position going into their next meeting with investors.
Want to know how robust your financial metrics really are right now? Schedule a no-obligation consultation with torq.partners, and together we’ll assess where you stand in terms of investor readiness.
Contents
Interim Support
Does your finance team need help?
Book a no-obligation initial consultation now.
Schedule a call
free download
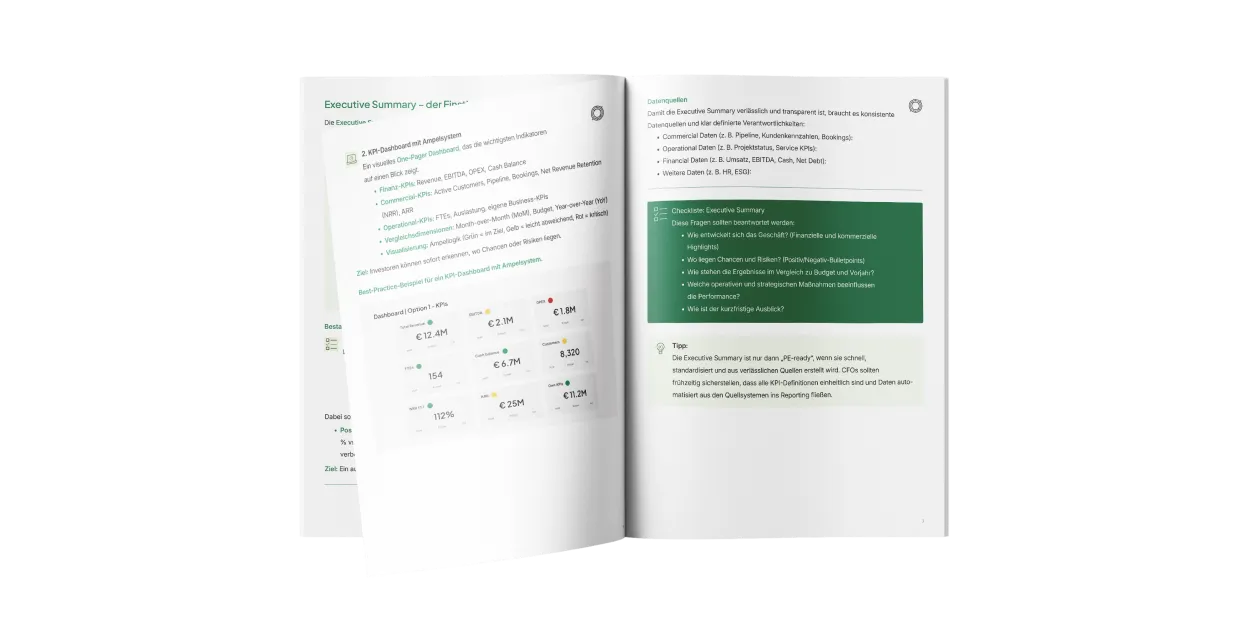
Investor Reporting at the Private Equity Level
Do's and Don'ts, Best-Practice Framework, and Checklist for Professional Investor Reporting at the PE Level. Free for CFOs and finance teams.
To Download →
podcast
Startup Funding 2025: The VC Market, Strategies, and Challenges with Kolja Heskamp
The VC Market Landscape in 2025, Fundraising Strategies, Profitability vs. Storytelling, and Investor Readiness.
Listen on Spotify →

More Articles



Investor Readiness
How Does Financial Due Diligence Work? A Step-by-Step Guide to the Process
Red Flag or Full Scope? Drawing on over 100 financial due diligence (FDD) reviews since 2022, we show what’s actually examined in a financial due diligence process and how it works. The guide for founders and investors before their next deal.
10.08.2026